I am pleased to publish the results of my third HSP survey which I launched in September 2015. Many thanks are due to the 109 people who gave their time and completed the survey - this wouldn't have been possible without you.
Here is a short version of the results. The full version goes into more detail on modifications made, and I hope that readers can use the information given to help themselves adapt to life with HSP. The full analysis can be found here:
https://drive.google.com/file/d/0BzEoTkR5HCWhRjMtejZhSGpHSG8/view?usp=sharing&resourcekey=0-pcbblZR9Vb7hu6OrJk7iOA
Grab Rails
Bath

This post reports a short version of the findings of an on-line survey undertaken between September 2015 and January 2016. 109 respondents with Hereditary Spastic Paraplegia (HSP) completed the survey, predominantly from the USA and the UK
The full version includes further detail on the mobility and change in mobility of respondents, more observations on modifications made around the home, greater detail on depression and quality of life and a set of data looking at the spastic paraplegia rating scale.
Mobility Analysis
All 109 respondents gave answers to
this question. From the results it is possible to see which mobility aids are the most regularly used. Around
two fifths of respondents use walking sticks/poles/crutches/canes, and
similarly, around two fifths of respondents use a wheelchair or mobility
scooter. FES is the mobility aid used by the
least number of people, with a take-up of around 5%.
In the remainder of this paper,
whenever “sticks” are referred to as a mobility aid, this term includes poles,
crutches and canes. Whenever “frames” are referred to this includes both
walking frames and rollators. Whenever “chairs” are referred to this includes
both wheelchairs and mobility scooters. Whenever AFO is mentioned it refers to
Orthotics and/or AFO.
The results also allow the
distribution of respondents within a scale of mobility to be understood. I have
devised an “HSP mobility score” which then allows me to cross-reference
mobility against the other questions in the questionnaire. The definition of
the HSP mobility score is;
- No mobility effects
- Can walk without aids but some
effects
- Orthotics/AFO/FES and/or
Sticks/Poles/Crutches/Canes some of the time
- Sticks/Poles/Crutches/Canes and
Frame/Chair some of the time
- Sticks/Poles/Crutches/Canes
most of the time
- Sticks/Poles/Crutches/Canes all
of the time
- Rollator/Walking frame most of
the time
- Rollator/Walking frame all of
the time
- Wheelchair/Mobility scooter
most of the time
- Wheelchair/Mobility scooter all
of the time
Overview of mobility aids used
Mobility Aids Used -
Overview:
|
Respondents
|
Percentage
|
Mobility Score
|
Those without aids
|
23
|
21%
|
0-1
|
Those who use mobility aids some of the time
|
20
|
18%
|
2-3
|
Those who use sticks most/all of the time
|
27
|
25%
|
4-5
|
Those who use frames most/all of the time
|
22
|
20%
|
6-7
|
Those who use chairs most/all of the time
|
17
|
16%
|
8-9
|
Modifications Around The Home
Overall, there were 99 respondents
who answered these questions. An overview of the data is
presented below, noting that respondents may appear in more than one of these categories:
Table 9 – Overview of Modification Data
Situation
|
Mobility 0-1
|
Mobility 2-3
|
Mobility 4-5
|
Mobility 6-7
|
Mobility 8-9
|
Total Answers
|
Total number of respondents
|
20
|
18
|
24
|
21
|
16
|
99
|
Zero modifications made
|
10
|
6
|
8
|
6
|
1
|
31
|
Furniture moved within the property
|
3
|
0
|
2
|
1
|
0
|
6
|
Have moved to a single storey property
|
5
|
2
|
5
|
5
|
7
|
24
|
Live on one floor within their property
|
1
|
2
|
0
|
1
|
1
|
5
|
Plan: Change property in the future
|
2
|
2
|
3
|
4
|
2
|
13
|
Plan: Stay at current property
|
3
|
9
|
7
|
6
|
6
|
31
|
Plan: Stay as long as possible
|
4
|
1
|
4
|
5
|
1
|
15
|
There were 31 respondents who indicated that they had made no modifications to
their properties. These fell into two general groups;
- those that had not made
modifications yet, and
- those who didn’t need to make
modifications because they had moved into an accessible property which
meets their needs.
Respondents across all mobility
bands have moved into properties which are either single storey or they are
able to live on a single storey within their existing property.
Plans to move properties reflect a
range of attitudes of people, with some people preferring to stay in their
current home and make whatever modifications they need to, with others planning
to move properties as the effects of HSP on their lives change. Different
respondents gave answers suggesting that moving property would be something which
they would expect to do in the near future whilst others were planning to move
in the longer term.
The overall conclusion of this
appears to be that as HSP progresses modifications will need to be made to
properties, and many respondents indicate that living in a single storey
dwelling makes life much easier. The requirement to move to a single storey
dwelling will depend ultimately on personal situations and preferences and the
progression of HSP, and there will be plenty of other factors in any decision
to stay or to move house.
There were 22 different types of modifications
which were mentioned by more than one respondent. As these questions were free-form answers I have had to make a few
assumptions on what respondents have meant in some cases, and therefore there
may be a small amount of variance in the data in this table.
Modifications by more than 5 people
Modification
|
Mobility 0-1
|
Mobility 2-3
|
Mobility 4-5
|
Mobility 6-7
|
Mobility 8-9
|
Total Answers
|
Total number of respondents
|
20
|
18
|
24
|
21
|
16
|
99
|
Grab rails (all data, in any location)
|
3
|
7
|
8
|
13
|
8
|
39
|
Ramps (external or internal)
|
1
|
2
|
5
|
4
|
5
|
17
|
Grab rails (within the shower or bath)
|
2
|
5
|
3
|
3
|
1
|
14
|
Accessible/raised toilet
|
2
|
2
|
2
|
2
|
4
|
12
|
Stair lift
|
0
|
3
|
0
|
3
|
5
|
11
|
2
|
1
|
2
|
2
|
4
|
11
|
|
Conversion of bathroom to wetroom
|
2
|
1
|
0
|
3
|
4
|
10
|
Hospital/power/electric/adjustable bed
|
0
|
0
|
1
|
2
|
4
|
7
|
Making the level of the bed lower
|
2
|
0
|
1
|
2
|
1
|
6
|
Modifications to the kitchen*
|
1
|
0
|
1
|
3
|
1
|
6
|
.
I have presented a commentary on
each of the most common modifications made, i.e. those with 10 or more
respondents, and there is more detail in the full version. The parts of
properties that are modified the most after the inclusion of grab rails are the
bathroom/toilet with a range of different modifications made. Adjustments to
beds are relatively common. Modifications in other parts of properties are made
less frequently. This would appear to reflect the importance of different
activities – using the toilet and keeping clean are important as is getting
sleep.
Grab Rails
Grab rails are by far the most
common modifications that are made around homes, and are present in some homes
at all levels of mobility. The majority of grab rails are installed in
bathrooms/toilets although respondents also included them by doors, in
bedrooms, kitchens, hallways, garages and other rooms.
The reasons
for installing grab rails fall generally into two groups, one group includes
reasons around helping to keep balance and move around, and the other group
includes reasons around helping to get up/down in/out off/on from things like
showers/baths/chairs/beds and getting up/down stairs. Reasons for installing
are often following similar incidents or being increasingly unable to do
something.
Advice for
others includes “Definitely help to keep you on your feet and preventing falls”,
“it is a small step to take but it makes life so much easier”, “Safety is more
important [than] decor or vanity”, “more confidence while showering”. Several
respondents mention talking to occupational therapists about this.
Ramps
Ramps are also a common modification,
again made by people at all levels of mobility. There are two general types of
ramps mentioned, the larger scale purpose built external ramp used for access
to the property, and smaller portable ramps which may be for use either outside
or inside the property.
Whilst many
of the respondents include in their reasons for installing ramps that it gives
them wheelchair access to parts of their property, other respondents indicated
that they have ramps because of their issues getting over/up/down steps when
walking. Most of the ramps are used by respondents who rely on mobility aids of
one kind or another all or most of the time.
Advice for
others includes looking on Amazon to purchase directly and purchasing second
hand ramps. “Worth doing provided you can” and “Very good, not too expensive.”
Raised/Accessible Toilets
This modification includes toilets
that were described either as raised or accessible and has been made across the
full range of mobility. Generally this was described as making it easier to
stand up/sit down from the toilet and was installed because people were finding
it difficult to do so. Advice for others includes “Really makes a big
difference” and “Make sure that the height of the [seat] suits you”.
A couple of
respondents who had been having work done on their bathrooms had elected to
install a taller toilet in preparation for expected future changes to their
mobility.
Stair lift
The stair lift tends to have been
installed by respondents who rely more frequently on mobility aids, although a
few respondents have had one installed earlier.
Stair lifts
are reported as giving access to otherwise inaccessible parts of the property or,
installed because it makes access easier to parts of the property by people who
have difficulties getting up or down stairs.
Advice for
others includes “Best thing I did! I'm not the only one who uses it!”, “Do it-
though ugly and expensive my back is better for it” and “It is beneficial if
you struggle to get upstairs”. Of those with lower mobility scores, the reasons
for installing are “Used a lot of energy and time”, “Assessment by Occupational
Therapist” and “to make life easier and safer”.
This modification covers several
things. Some respondents describe having a seat, chair or stool in their bath
or shower and others describe having a bath board – i.e. a board which spans
the bath which you can sit on. This modification has been made by people across
the range of mobility.
What is not
clear from all of the descriptions is if these seats are fixed to wall/bath or if
free standing seats have been added. From the descriptions some clearly are
permanent. These are described as helping people keep from falling, prevention
of dizziness, helping get in/out of the bath/shower, relieving fatigue. These
are installed in showers generally when people are no longer able to stand, or
after a fall. Advice for others includes “makes showering much more enjoyable”
and “Just do it. It helps so much”
Conversion of bathroom to wetroom, or conversion of
bath to shower.
The wetroom modification has been
made by a number of respondents across the range of mobility. Some have
specifically referred to this modification as a wetroom whereas others have
described it as having a shower level with the floor. Where it is not clear if
the shower is level with the floor or not I have grouped as “conversion of bath
to shower”, and there is some uncertainty here.
The main
reason for making this modification is enabling the respondent to shower because
getting in/out of the bath has become difficult or impossible. Advice for
others includes “It has made bathing so much easier.” “it helps so much”, “Strongly
consider keeping a bath as laying in the bath reduces stiffness.” “Bathroom
mods are expensive. Get professional advice and plan carefully if you need to
modify an existing bathroom.” These comments show that the decision to make
this modification may difficult for some.
Modifications Conclusions
There is a wide range of
modifications that people have made around their properties and the approach
depends heavily on personal preferences. Modifications tend to be made after a
change in mobility/symptoms has been noticed, particularly after an
incident/accident. Although, some people are planning for future changes in
mobility. I asked respondents for the length of time that they have had these
modifications, but there is sufficient information from the mobility scores to
establish the general pattern.
Frequently the first modifications
made are the installation of grab rails within the property, and these are
often fitted in the bathroom first. Subsequent modifications are made depending
on the rate of progression of HSP. The parts of properties which are modified
the most after the inclusion of grab rails are the bathroom/toilet with a range
of different modifications made. Adjustments to beds are relatively common.
Modifications in other parts of properties are made less frequently.
Some people prefer to make
modifications within their existing property whilst others prefer or have to
move into accommodation which has been or can be set up to meet their needs.
Some people are designing and building their own property to their own
specification. Other key factors in modifications and moving home are
practicality and affordability.
8) Depression
I included the two question Patient
Health Questionnaire-2 (PHQ2 http://www.cqaimh.org/pdf/tool_phq2.pdf
and http://www.apa.org/pi/about/publications/caregivers/practice-settings/assessment/tools/patient-health.aspx)
in my survey, and followed the scoring given for these questions. 104 respondents completed this part
of the survey, and the following table shows the results, by mobility score and
by total score:
PHQ-2 Scores
Mobility score
|
Respondents
|
Score 0
|
Score 1 or 2
|
Score 3 or 4
|
Score 5 or 6
|
Percent 1 to 5
|
Percent 3 to 6
|
Percent 5 or 6
|
0 or 1
|
21
|
9
|
7
|
3
|
2
|
57%
|
24%
|
10%
|
2 or 3
|
19
|
9
|
8
|
0
|
2
|
53%
|
11%
|
11%
|
4 or 5
|
26
|
7
|
12
|
7
|
0
|
73%
|
27%
|
0%
|
6 or 7
|
21
|
8
|
4
|
6
|
3
|
62%
|
43%
|
14%
|
8 or 9
|
17
|
6
|
7
|
3
|
1
|
65%
|
24%
|
6%
|
Overall
|
104
|
39
|
38
|
19
|
8
|
63%
|
26%
|
8%
|
Overall this study shows 63% of
respondents having some symptoms of depression and 37% without those symptoms.
Additionally, it suggests that around one quarter of people with HSP may
require further assessment for depression, particularly for those who are using
walking frames all or most of the time to get around. Figure 1 shows the
results in more detail, giving the split of assessment scores in each mobility
band.
Looking at the highest scores,
where people have “Little interest or pleasure in doing things” and/or “Feeling
down, depressed or hopeless” nearly every day, it is my hypothesis that this
seems to occur at the beginning of peoples’ journeys with HSP and at the point
where people are beginning to lose the ability to walk. These highest scores
are not seen in whose who have accepted the use of walking sticks and are not
often in those who have accepted the use of a wheelchair, and perhaps the
acceptance of these mobility aids relieves the depression. I repeat, this is
just my hypothesis and I accept there is not much to back this up. Interestingly,
the three respondents with the most rapid change in mobility in five years
score 2, 2 and 3.
As a comparator, According
to the World Health Organisation (http://www.who.int/mental_health/management/depression/who_paper_depression_wfmh_2012.pdf)
350million people in the world were affected by depression. The population in
2012, when that was published, was around 7 billion, giving a prevalence of
around 5%. It is not
clear what those people affected by depression would score
using PHQ2.
There is also one paper which
estimates the prevalence of depression in HSP in Estonia
My conclusion is that the responses
to this survey show that people with HSP appear to suffer from depression more
than the general population. It is not possible to correlate scores between the
PHQ2 used here and the Beck Depression Inventory, however, the Estonian study shows
around 60% of people with HSP having some form of depression and my results shows
that 63% having a score above zero. This may indicate a similar result.
Quality of Life
The next section of the questionnaire
looked at respondents’ quality of life. Respondents were asked 3 questions
about physical functioning and 2 questions about social functioning from the
Patients Like Me Quality of Life survey (https://www.patientslikeme.com/
and https://www.openresearchexchange.com/public/library/instruments/16/instructions
). In the full survey there are 11 physical functioning questions, 8 mental
functioning questions and 5 social functioning questions. The questionnaire is
used across many conditions and I selected a few general questions as a sample.
The
questions on physical functioning were:
·
How
much has your health limited you in accomplishing as much as you would like to?
·
How
much has your health limited you in the type of work or other activities you
can do?
·
How
much has your health limited you in doing your work or other activities?
The
questions on social functioning were:
·
Did
your physical health interfere with your social activities with family,
friends, neighbours or social groups?
·
Did
your emotional problems interfere with your social activities with family,
friends, neighbours or social groups?
Respondents selected from options
which each have a score out of 4, which is multiplied by 25 to covert it to
a percentage, and an average is taken. The average score is then ranked as
follows:
·
85-100%
- Best
·
50-85%
- Good
·
15-50%
- Bad
·
0-15%
- Worst
In total
102 respondents answered this question, and the following results are shown:

The physical functioning results show that over 60% of respondents score good or best when using no mobility
aids or when they are used some of the time (mobility score 0 to 3). There are
no clear differences between these two mobility bands. Once mobility aids are
used most or all of the time (mobility score 4 to 9) the physical functioning
score lowers, with around 30% of respondents scoring good or best. Again, there
are no clear differences between these three mobility bands. There may be an
upturn in physical function for those most affected by HSP, perhaps as they
have optimised their lives to their mobilties.
This sample
analysis appears to show that a step change in quality of life occurs at the
point when mobility aids are needed to be relied on more often.

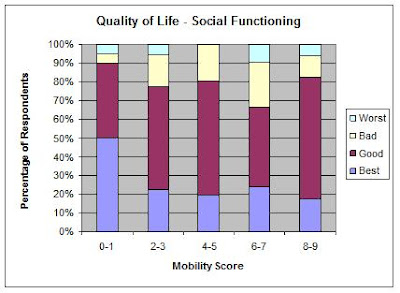
The social functioning results show that before mobility aids are needed (mobility
score 0 or 1) around 90% of respondents score good or best for social
functioning. Once mobility aids need to be used (mobility score 2 to 9), the
percentage of respondents scoring good or best drops to around 75%.
Within this,
the proportion of respondents scoring best drops from 50% with no mobility aids
to around 20% when some are needed. Once mobility aids are used the social
functioning score does not change significantly, and this sample analysis
appears to show that a step change in quality of life occurs at the point when
mobility aids are needed.
The conclusion I draw from this is
that HSP does affect quality of life and there appear to be two step changes,
the first step change is a reduction in social functioning at the point when
mobility aids are needed and a step change in physical functioning when
mobility aids need to be relied on most or all of the time.
Like this? in other years:
Overview of all my surveys: http://hspjourney.blogspot.co.uk/p/my-on-line-resarch.html
2016: Fatigue, bladder, bowel & information: http://hspjourney.blogspot.co.uk/2017/02/2016-survey-results.html
2014: Medication, exercise & relaxation: http://hspjourney.blogspot.co.uk/2015/02/2014-survey-results.html
2013: Symptoms and misdiagnosis: http://hspjourney.blogspot.co.uk/2014/02/hsp-survey-results.html